Methodology
Halloumi
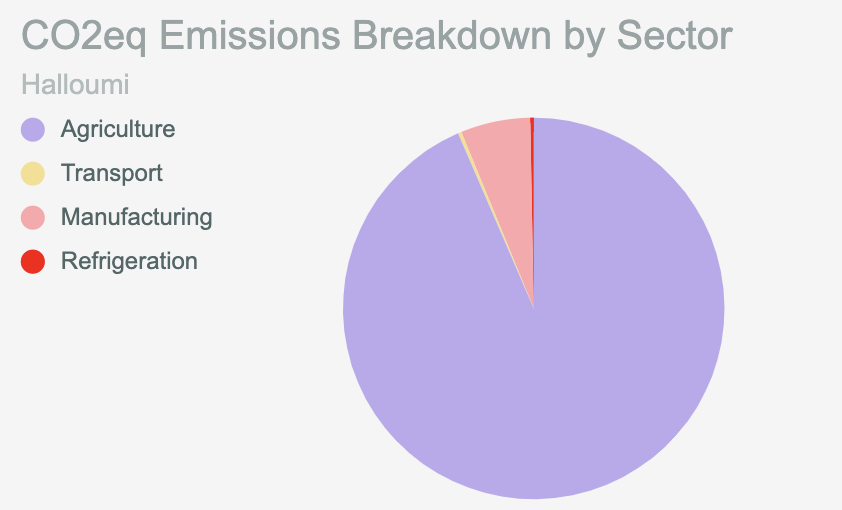
The Halloumi emissions calculation includes emissions from agriculture, transport, manufacturing, and refrigeration. For cheeses, the calculation not only consists of CO2 (as in the other pages on this calculator), but includes methane as well. The result is in terms of CO2 equivalents.
To summarise agriculture calculations, we estimated the mass of milk required per kilogram of Halloumi, found the approximate amount of days it would take each animal to produce their respective mass of milk, and then calculated the emissions over that time period from food, manure management, and enteric fermentation for goats and cows. These values are all methane emissions, so the emissions were multiplied by 25 to find the CO2 equivalents.
For transport, we used a refrigerated truck emissions factor and multiplied it by an estimate of the average distance between dairy plants and grocery stores in Cyprus. This distance estimate was found by averaging the distance from 6 different dairy plants on the island to 5 of the major cities (not including locations in Northern Cyprus). We found the average transportation distance to be approximately 80 km, though changing this value has almost no effect on the overall emission.
Manufacturing emissions were found using a simple calculation in which we found the heating temperature required to produce Halloumi cheese, calculated the energy required to reach that temperature, and multiplied by an energy emissions factor.
Refrigeration was one of the harder estimates as refrigeration time from production to consumption varies drastically. For simplicity purposes, we assume the total refrigeration time is 72 hours not including the time in the refrigerated transport truck.
It is important to know that the most rigorous calculations were done for agriculture, and agriculture makes up the largest portion of total emissions. The chart below shows the breakdown. Although our estimate for refrigeration time is not very rigorous, it has very little effect on the final value as does transportation.
We are unable to verify our Halloumi emissions by comparing our value to other Halloumi estimates, so the next best thing is a comparison to other cheeses. For example, goat cheeses in France emit roughly 8.5 kg CO2 equivalents per kg cheese. Our calculations for Halloumi suggest that its emissions are around 8.16 kg CO2 equivalents per kg cheese. While production factors vary in these two locations, a ballpark validation is achieved.
Sources:
Halloumi recipe
Used to determine the total amount of milk needed from all animals
Average daily milk output of Holstein Friesian cows (most common dairy cow in Cyprus) in hot environments
Results shown in abstract. Value used was 17.6 kg milk per cow per day.
Enteric fermentation and manure management emissions factors for dairy cattle and goats
https://www.ipcc-nggip.iges.or.jp/public/gl/guidelin/ch4wb1.pdf
Table 4.3: cow enteric fermentation emissions factors
Table 4.5: cow manure management emissions factor
Table 4.2: goat enteric fermentation emissions (developed countries)
Table 4.4: goat manure management emissions (developed countries, warm)
Cow food needed per day
https://en.engormix.com/dairy-cattle/articles/feeding-dairy-cows-t33333.htm
Dry matter intake section. Assumed 20.4 kg per day.
Emissions of feed for cows and goats
https://www.klimatmarkningen.se/wp-content/uploads/2009/12/2009-2-feed.pdf
Page 8. Found the average of 370 and 465 g CO2eq/kg.
Average daily milk output of Damascus goats in Cyprus
May require institutional access (university/company login). Abstract: average daily milk yield stat.
Damascus goat feed needed per day
https://www.gov.mb.ca/agriculture/livestock/goat/pubs/goats-and-their-nutrition.pdf
Refrigerated truck emissions factor
https://consumerecology.com/carbon-footprint-from-the-regional-distribution-center-to-retail/
Under section describing emissions from distribution centre to retail. Refrigerated truck, 7.5-15 tonnes.
Temperature required to make milk into cheese
Recipe says the highest temperature required for the cheese is roughly 85 C, and assuming cheese starts at 5 C.
Refrigeration energy required per unit volume
Divided fridge wattage by volume to find energy required to refrigerate each cubic metre. Then, used emissions factor for electricity as found in the energy section of this calculator to find emissions required for refrigeration.
Comparison to emissions of producing other types of cheese
On page 24 you will find a plot detailing the emissions of multiple types of cheese from a few countries
Scottish Cheddar
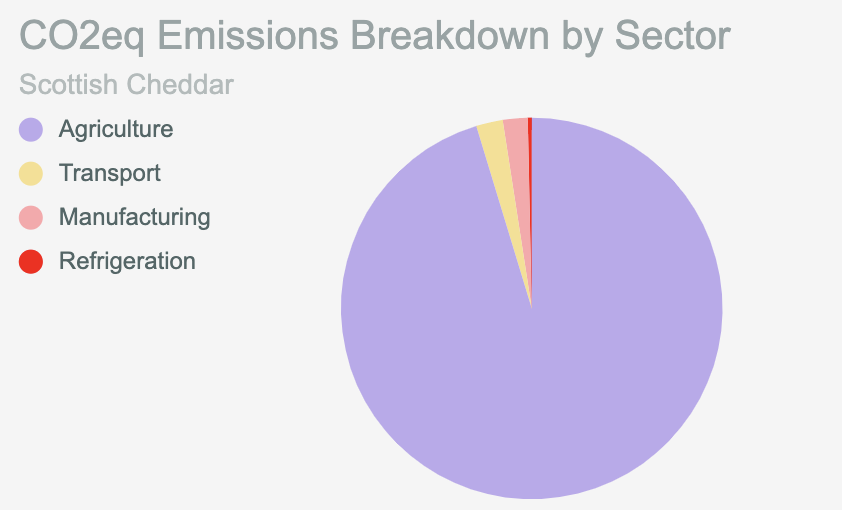
Similar to the Halloumi calculations, Scottish cheddar emissions were calculated by considering agriculture, transport, manufacturing, and refrigeration. The calculated values are in CO2 equivalents for Scottish cheddar rather than CO2 alone due to the quantity of methane released by dairy animals.
For agriculture, the same main steps from Halloumi are followed, though only cow milk must be considered. First, we find the amount of days it takes a cow to produce the necessary amount of milk per kilogram of cheddar, and then multiply this value by the emissions factors for enteric fermentation, manure management, and feed emissions. These emissions factors are for methane, so once finding the total methane emissions from the cow, this value is multiplied by 25 to convert into CO2 equivalents.
Next, transportation is considered which involves both importing to Cyprus as well as transportation on the island. Approximate distances were found (measured from Connage Highland Dairy Farms to Forth Ports in Scotland by refrigerated truck, Forth Ports to Larnaca in Cyprus by ship, and Larnaca to Engomi by refrigerated truck) and multiplied by emissions factors for the relevant vehicles.
Manufacturing and refrigeration emissions were calculated using the exact same methodology as outlined in the Halloumi methods section.
As validation, we compared our emissions values to those of producing other cheeses. For example, to produce one kg of cheddar in the US, approximately 8.377 kg of CO2 equivalents are emitted. In France, approximately 5.8 kg of CO2 equivalents are emitted per kilogram of feta produced. According to our calculations, approximately 7.33 kg of CO2 equivalents are emitted. This suggests that our number is likely in the correct ballpark range, though it is difficult to validate beyond that.
Sources:
Average daily milk output of Ayrshire cows (most common dairy cow in Scotland)
“Milk production of Ayrshire cows” section.
Milk needed for 1 kg of cheddar
Enteric fermentation and manure management emissions factors for dairy cattle
https://www.ipcc-nggip.iges.or.jp/public/gl/guidelin/ch4wb1.pdf
Table 4.3: cow enteric fermentation emissions factors (Western Europe)
Table 4.5: cow manure management emissions factor (Western Europe, cold)
Cow feed needed per day
https://en.engormix.com/dairy-cattle/articles/feeding-dairy-cows-t33333.htm
Dry matter intake section. Assumed 20.4 kg per day.
Emissions of feed
https://www.klimatmarkningen.se/wp-content/uploads/2009/12/2009-2-feed.pdf
Page 8. Found the average of 370 and 465 g CO2eq/kg.
Shipping distance
Forth Ports, Scotland to Larnaca, Cyprus.
Ground distances
Connage Dairy Farms to Forth Ports, Scotland. Larnaca, Cyprus to Alphamega in Engomi, Cyprus.
Refrigerated truck emissions factor
https://consumerecology.com/carbon-footprint-from-the-regional-distribution-center-to-retail/
Under section describing emissions from distribution centre to retail. Refrigerated truck, 7.5-15 tonnes.
Shipping emissions factor
Fourth IMO GHG Study 2020 Executive Summary
Page 15, table 3, EEOI (k CO2/t/nm), 2018 value.
Heating temperature required
Temperature gets up to roughly 40 C, assuming cheddar is stored at 15 C.
Power per unit volume of refrigeration
https://files.bbystatic.com/BKmG3hXc5jJSlFyi0Yxh7Q%3D%3D/Spec%2BSheet
Divided fridge wattage by volume to find energy required to refrigerate each cubic metre. Then, used emissions factor for electricity as found in the energy section of this calculator to find emissions required for refrigeration.