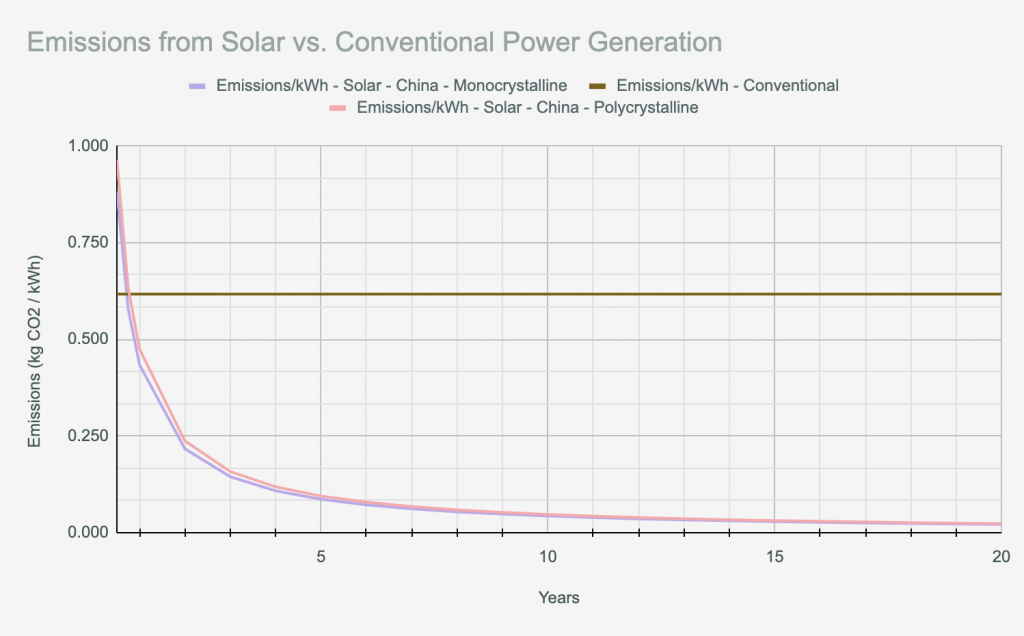
The figure above demonstrates the difference in emissions per kWh for 2 solar cases vs conventional power sources. Note: the y-axis begins at 0.5 years. The switch from when solar becomes more environmentally friendly than conventional power sources occurs at right around 2 years. The emissions lines for solar panels produced in countries other than China vary.
Methodology
Fossil Fuel Energy Emissions
CO2 emissions for fossil fuel energy production are calculated using a single user input and Cyprus-specific sourced data. In the simplest terms, the calculator takes the amount of power needed by the user and estimates the amount of fuel this would take, then multiplies this amount of fuel with an emissions factor (the ratio between CO2 emitted and fuel consumed). A more rigorous description of the calculation is shown below.
Due to a lack of available data from the Electricity Authority of Cyprus (EAC), certain derivations and approximations were made. To begin, only the power capacities of each station in Cyprus (Vasilikos, Dhekelia, and Moni) are published, so we had to estimate the actual power production breakdown among the three stations. To do so, we assumed that for every kilowatt of power drawn from the grid, the percentage of energy drawn from each plant is the same as the percentage capacity of each plant.
Once estimating the power that needs to be produced at each plant, we estimate the amount of power that needs to come from each power production method (steam turbines, internal combustion engine, etc.) within each plant. This was also done by assuming that the power draw from each method was proportional to the percentage of the capacity of the plant that it accounts for. The various power production methods all have different efficiencies, even plant to plant. For example, steam turbines at Vasilikos have different efficiencies than the steam turbines at Dhekelia. Because of this, we used the efficiency of each method and power that must be produced at each to estimate the fuel required by each set of machinery. Next, we summed up the total amount of diesel and heavy fuel oil (HFO) needed across the plants (as current EAC power production requires one of these two fuel types), and multiplied these quantities by fuel dependent emissions factors. This leads to total emissions from diesel and HFO powered methods, which are then summed to find the total emissions required to produce the inputted amount of power needed by the user.
Our emissions values were validated using 2 methods. The first involved comparing the emissions per unit energy that we calculated with the 2021 value published by the EAC. The EAC emissions value includes emissions from both fossil fuel sources (~86% of production) with renewables (~14% of production), and accordingly their value is 1.7% lower than ours. The second method compared our CO2 emissions per kilowatt-hour with the EU average, which yielded only a 7% difference from our result, suggesting that our estimates are reliable.
Sources:
EAC data on power capacity at each plant, efficiencies, and fuel types
https://www.eac.com.cy/EN/RegulatedActivities/Generation/powerstationcapacity/Pages/default.aspx
This page details the power production machinery at each plant and their corresponding capacities. On the left hand panel of the page, you can click on the link to Vasilikos, Dhekelia, and Moni power stations. These pages describe the fuel type used and efficiency of each technology, as well as the power generation percentage produced by each plant.
EAC published emissions per unit energy value
This is a one page document. Immediately below the table, there is a sentence that shares the emissions per kWh from the EAC, which produces roughly 86% of its energy using fossil fuels and the remainder using renewables. The published value is slightly lower than ours (by about 1.7%) which makes sense given that renewables have lower emissions values which brings that average power emissions down.
EU Average Fossil Fuel Energy Production Emissions
WARNING: clicking this link will download a pdf to your computer.
https://publications.jrc.ec.europa.eu/repository/bitstream/JRC21207/EUR%2019754%20EN.pdf
Figure 15 on page 22/61 demonstrates a plot of maximum and minimum specific CO2 emissions quoted in literature. Assuming an average specific emissions value for oil of about 680 g CO2/kWh, our result is off by less than 3% for the emissions of fossil fuel produced energy.
Annual power usage in Cyprus
https://www.worlddata.info/asia/cyprus/energy-consumption.php
3583 kWh per person per year = ~298.6 kWh per month
Photovoltaic Energy Emissions
Emissions for photovoltaic (PV) power include estimates from the production of solar cells, power generation, and importing of the cells. Using our calculator, a user is able to input the country that the cell is imported from as well as what type of cell they are interested in.
A large amount of the manufacturing process for PV systems relies on electricity for smelting & processing of the raw materials. In all, the manufacturing of a square metre of solar panel requires 183 kWh of electricity and produces 2.95 kg of CO2 directly to the atmosphere – not including the emissions from the electricity requirements. It is important, then, to consider the emissions per kWh of electricity from sources on the grid. For instance, Brazil – which gets a great deal of electricity from hydroelectric sources – produces a mere 0.0617 kg of CO2 per kWh, whereas a country that relies more heavily on coal, like China, produces nearly 10 times as much CO2 for the same amount of electricity, at 0.5374 kg of CO2 per kWh. This results in a substantial difference in the lifetime emissions of PV generation depending on where they were manufactured.
Additional considerations also come into play in order to be thorough, like the transportation of panels. In order to calculate this the emissions from transport, in the manufacturing country, from importing to Cyprus, and from transport on the island were calculated. The shipping industry produces a great deal of the world’s emissions, but maritime freight is also responsible for most of the world’s transport. In fact, the emissions from transporting a square metre of solar panel from Brazil produces only 1.61 kg of CO2.
In order to make this information comparable, it was then necessary to find the amount of electricity generated from a square metre of panel over its lifetime. This was done in two ways: The first, by multiplying the efficiency of the solar panel (monocrystalline = 17%, polycrystalline = 14%) with the average daily solar irradiance of Cyprus to give kWh per m^2; and the second, using PVlib, a free, open-source software which can handle more inputs and gives more precise data. In both cases, the emissions per m2 was divided by each value to give kg CO2 per kWh. In general, the amount of electricity from PVlib was preferred and this is the one that is used when presenting results.
Using our method, we found that over 20-year timespan solar systems in Cyprus would emit roughly 22 g CO2e/kWh for monocrystalline systems, and 24 g CO2e/kWh for polycrystalline systems. This is on the low end of other research data – most sources give roughly 40 g CO2/kWh – but some are “more optimistic, with estimated emissions below 21 g CO2e / kWh.” Additionally, the time for solar panels to become better for the environment than conventional power is usually listed at around 2 years (compare to our value – 0.75), however Cyprus is an incredibly sunny place and also has a fairly dirty energy grid, so it should be expected to be lower than average.
Sources:
Data on the emissions factor (kg CO2e/kWh) for different countries of production:
https://www.carbonfootprint.com/docs/2022_03_emissions_factors_sources_for_2021_electricity_v11.pdf
Allows us to compare the emissions when using electricity from the grid.
Investigation of life cycle CO2 emissions of the polycrystalline and cadmium telluride PV panels:
https://doi.org/10.1016/j.enmm.2020.100343
Research paper into the direct and indirect emissions of CO2e and electricty draw of solar panel production. It also provides us with baseline figures for the efficiencies of different solar cells
Solar Insolation for Cyprus:
This paper allows us to figure out how much pure sunlight energy is received by the earth, it states, “The average solar radiation for Cyprus is 5.06 kWh/m2/d”
Weight of solar panels
https://solarbay.com.au/newsroom/installing-solar-panels-the-importance-of-site-conditions/
This source provides us with a rough estimate of the weight of solar panels per unit area (15 kg/m2)
Amount of solar cells per TEU:
https://blog.solarnub.com/en/logistics-containers-for-solar-panels/
This source allows us to figure out how many solar cells can fit in a standard shipping container which is very important when we calculate the emissions from importing.
Emissions of Maritime Freight:
https://www.bsr.org/files/clean-cargo/BSR-Clean-Cargo-Emissions-Report-2020.pdf
This allows us to compare different regions and shipping lanes and see how much CO2e is emitted from shipping. The standard units here are gCO2e/TEU*km, where TEU is a twenty foot equivalent unit – what we think of as a standard shipping container.
PVlib
William F. Holmgren, Clifford W. Hansen, and Mark A. Mikofski. “pvlib python: a python package for modeling solar energy systems.” Journal of Open Source Software, 3(29), 884, (2018). https://doi.org/10.21105/joss.00884